Building a NextDNS Tidbyt Applet

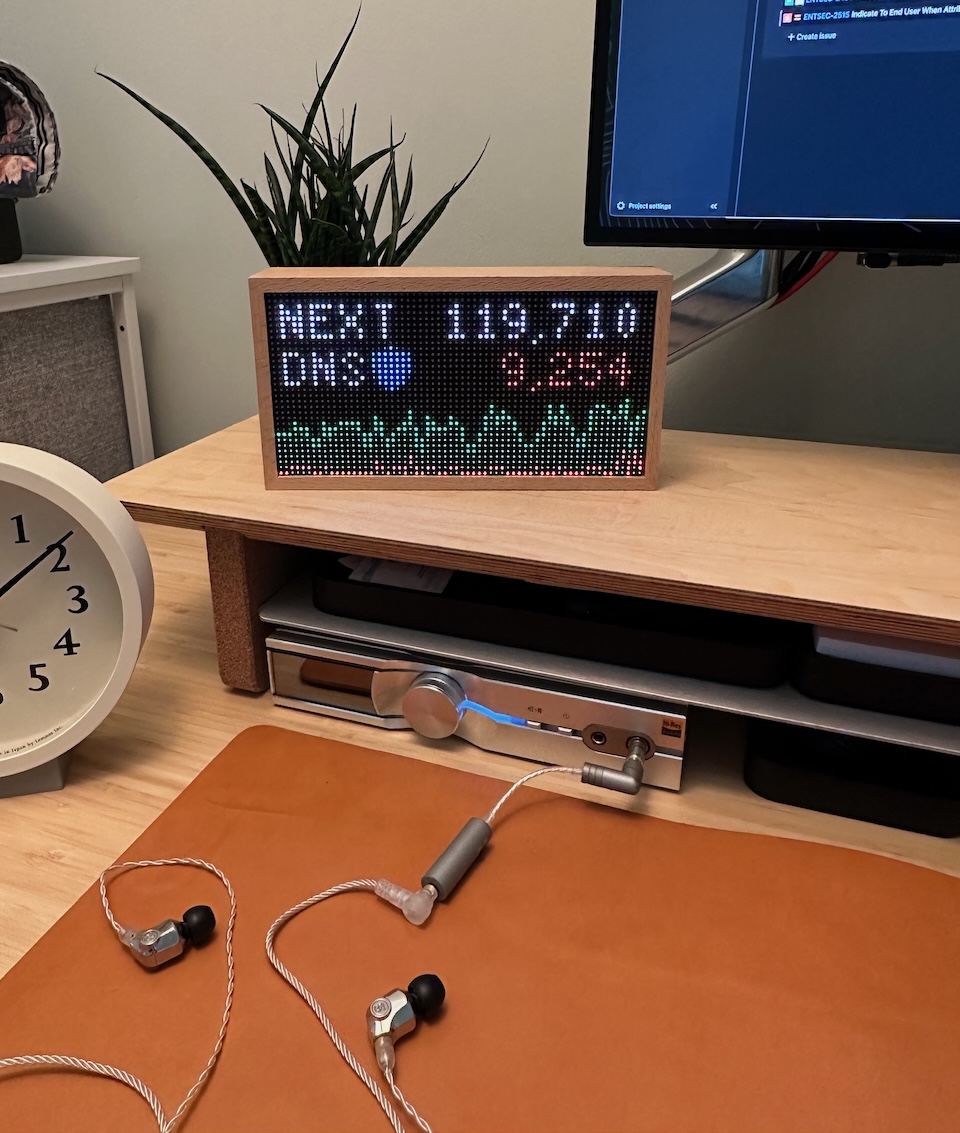
How fun would a sleek, retro-inspired wood box that could make API calls and display lofi 8-bit animations be? That's what I thought when I discovered Tidbyt and immediately bought one.
What time is it? What's the weather like? When does the next subway depart? How many NextDNS queries have your devices made over a 7-day period? There's a Tidbyt applet for that! Or at least, now there is - I had to contribute the last one myself. Which turned out to be a fun afternoon project.
The Inspiration
For hi-fi audio hobby reasons, I run a music server at home for streaming hi-fi music to my sound systems. When I got the idea for wanting to access that while on the go without exposing it to the public internet, I came across Tailscale's nifty subnet routing functionality. That in turn led me replacing my aging raspberry pi PiHole with NextDNS as the DNS provider for my Tailnet (what Tailscale calls your personal private network that connects your devices to one another).
As I experimented with varying levels of DNS blocking for ads, trackers, etc. I found myself wanting the ability to see how many requests were being blocked so I could optimize my configuration and also catch if my setup was completely blocking me from something I was trying to access, privacy sacrifices be damned. This got me thinking the Tidbyt would be a fun way to keep up-to-date with my DNS activity while also giving me the chance to contribute to their growing community applet store.
Developing on Tidbyt Development
Tidbyt apps are crafted using Pixlet, an app runtime and UX toolkit tailored for pixel-based displays. Pixlet employs Starlark, a Python-like language, making it relatively approachable for those familiar with Python's syntax. That said, I still found myself wishing it just used actual Python every time I discovered a missing built-in or somewhat lacking functionality. But I digress.
The Tidbyt developer documentation provides a great starting foundation and guide for going through the process of creating and rendering an applet if you find yourself wanting your own niche 8-bit display.
The NextDNS API
Fetching real-time statistics was made easy by the NextDNS Analytics API endpoint, as it supports filtering by time-range. I opted for a 7 day time-range because I have my NextDNS configuration set to expunge DNS records older than that on a rolling basis.
Order of operations
So, how does it all come together?
- Secrets: First the applet pulls the NextDNS
profile_idandapi_keysecrets from the user's companion Tidbyt mobile app that provides the capability of accepting config values from users.
def get_secrets(config):
    profile_id = config.get("profile_id").strip()
    api_key = config.get("api_key").strip()

    if profile_id == "" or api_key == "":
        fail("Missing NextDNS profile id or api key value: please restart app with both values supplied")

    return {
        "profile_id": profile_id,
        "api_key": api_key,
    }
- Data Retrieval: Next, we retrieve the user's DNS statistics from the NextDNS
analyticsAPI endpoint, setting a lookback period of 7 days and an interval of 10,800 seconds (3 hours). This approach balances capturing meaningful patterns and trends without producing an overwhelming number of datapoints. Given the Tidbyt's 64x32 pixel display, optimizing data granularity is a fun challenge to solve for in pursuit of creating clear but effective visualizations.
(As an added bonus, Starlark'shttppackage introduced native caching via thettl_secondsparameter, letting the applet avoid needlessly hammering the NextDNS API.)
def query_nextdns(api_key, profile_id, endpoint, **kwargs):
    endpoint = endpoint.format(profile_id)
    url, headers = build_get_request(endpoint, api_key, since = kwargs.get("since", None), interval = kwargs.get("interval", None), limit = kwargs.get("limit", None))

    resp = http.get(url, headers = headers, ttl_seconds = 240)
    if resp.status_code != 200:
        fail("NextDNS %s request failed with status %d", endpoint, resp.status_code)

    return resp.json()
- Data Visualization: Now we parse the NextDNS
analyticsresponse and format the data into a format Starlark'srenderpackage can plot. For our purposes, all that was required was creating a list of tuples, each representing a point on the plot.
def create_plot(datapoints):
    plot = []
    index = 0

    for query_ct in datapoints:
        plot.append((index, query_ct))
        index += 1

    return plot
- Formatting the Display: Finally, we have to render everything! And this means literally counting pixels to not only get everything
aligned, but also fitting on the extremely limited display real estate.
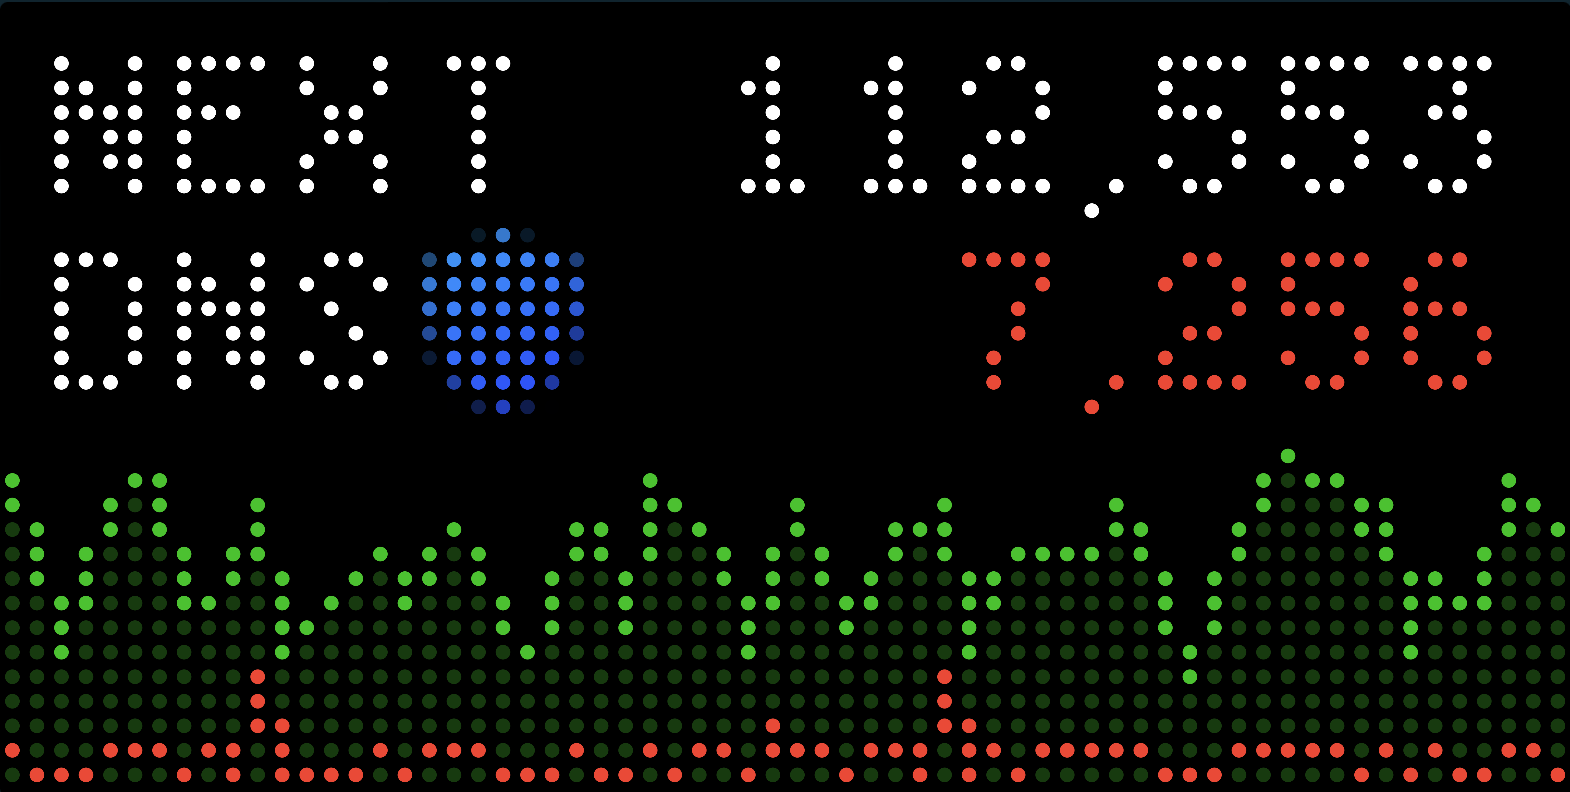
This proved to be the most fun and interactive part of the process playing around with how to fit the most amount of data on the screen while keeping things legible and easy to understand at a glance. Thankfully, Pixlet makes this accessible to developers via the CLI with the--gifflag:pixlet render apps/{{appname}}/{{app_name}}.star --gif --magnify 10
return render.Root(
    render.Column(
        expanded = True,
        main_align = "space_between",
        children = [
            render.Padding(
                pad = (2, 1, 1, 0),
                child = render.Row(
                    expanded = True,
                    main_align = "space_between",
                    children = [
                        render.Column(
                            children = [
                                render.Text("NEXT", font = "5x8"),
                                render.Row(
                                    children = [
                                        render.Text("DNS", font = "5x8"),
                                        render.Image(NEXTDNS_LOGO, width = 7),
                                    ],
                                ),
                            ],
                        ),
                        render.Column(
                            cross_align = "end",
                            children = [
                                render.Text(str(total_queries)),
                                render.Text(str(total_blocked), color = RED),
                            ],
                        ),
                    ],
                ),
            ),
            render.Row(
                expanded = True,
                children = [
                    render.Stack(
                        children = [
                            render.Plot(
                                data = total_queries_plot[1:],
                                width = 64,
                                height = 14,
                                color = GREEN,
                                fill = True,
                                y_lim = (0, max(graph["data"][0]["queries"])),
                            ),
                            render.Plot(
                                data = blocked_queries_plot[1:],
                                width = 64,
                                height = 14,
                                color = RED,
                                fill = True,
                                fill_color = "#660500",
                                y_lim = (0, max(graph["data"][1]["queries"]) * 3),
                            ),
                        ],
                    ),
                ],
            ),
        ],
    ),
)
The Outcome
The end result? A Tidbyt applet that brings your NextDNS statistics to life in 8-bit form! This ended up being a lot of fun and forced me to figure out how to visualize my DNS activity to pixel perfection, all while creating a retro-cool visual to add to my desk.

If you're interested, you can check out my full nextdns.star applet in Tidbyt's community
repo - or even contribute to it yourself!